Introduction
Managing utility expenses efficiently is crucial for businesses aiming to reduce operational costs and improve sustainability. Our Utility Cost Savings template in Data Responder helps you monitor energy consumption trends by tracking monthly meter readings for electricity, water, gas, and heating. With built-in analytics, you can easily compare usage patterns and identify potential savings.
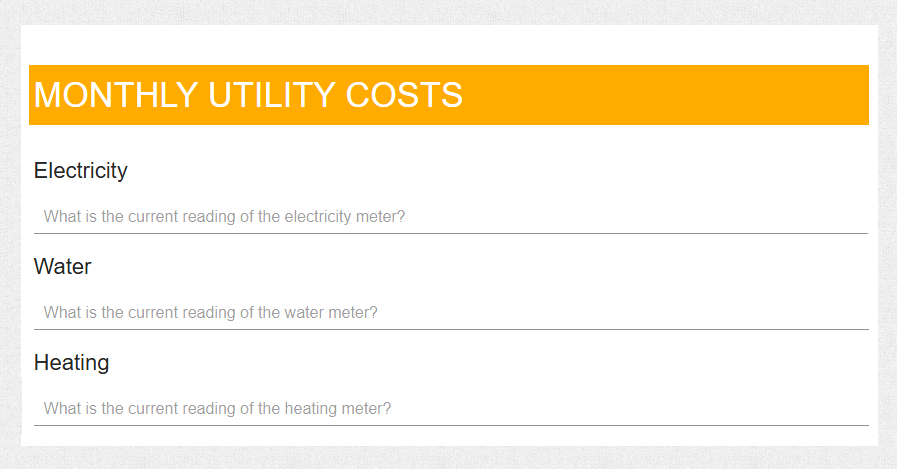
Form
Collecting monthly data directly from on-site utility meters is the simplest approach. Data Responder will automatically remind you of deadlines. You can customize the form by adjusting the number of meters or selecting the utilities you want to monitor, such as electricity, water, gas, oil, heat, sewage, etc. Alternatively, you can rely solely on utility cost invoices, but this method is effective only if the invoices cover the same calendar month periods consistently.
How the Template Works
The Utility Cost Savings template is designed to provide a clear overview of your utility consumption over time. By inputting monthly meter readings for each type of utility, businesses can:
- Track consumption trends across different periods.
- Identify anomalies in energy usage that may indicate inefficiencies.
- Compare costs over time to spot areas for potential savings.
- Analyze year-over-year (Y/Y) changes to evaluate long-term progress.
In the Utility Cost Savings template, the “current from increasing” processing function is used to automatically calculate monthly consumption based on cumulative meter readings.
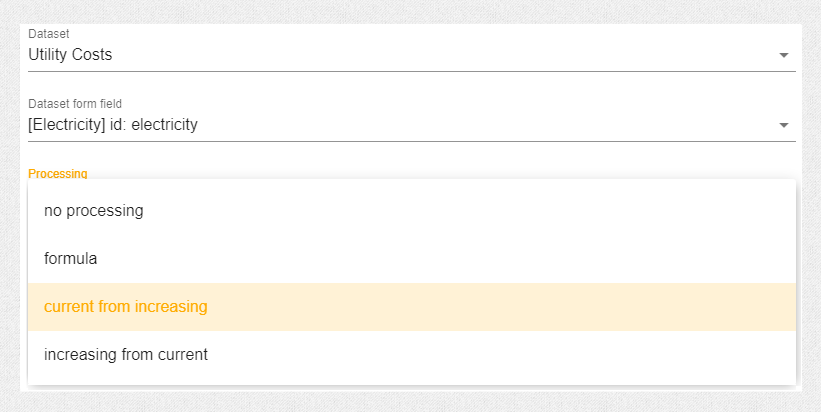
This allows users to enter only the current meter values, while the system determines the monthly usage by computing the difference between consecutive readings:
$$
C_{\text{monthly}} = C_{\text{current}} – C_{\text{previous}}
$$
The template is especially useful for organizations looking to implement and measure the effectiveness of energy-saving strategies.
Analyzing Utility Consumption
Effective energy management relies on precise data analysis. Our template supports two key methods for evaluating consumption trends:
1. Percentage Change Comparison
This method calculates the percentage increase or decrease in consumption between two consecutive months using the formula:
$$
\% \text{ Change} = \left( \frac{\text{Current Month Value} – \text{Previous Month Value}}{\text{Previous Month Value}} \right) \times 100
$$
This allows businesses to detect spikes or reductions in usage and take corrective action if necessary.
2. Year-over-Year (Y/Y) Comparison
Y/Y analysis compares the same month’s consumption across different years to eliminate seasonal effects and observe long-term trends. The formula is:
$$
\% \text{ Y/Y Change} = \left( \frac{\text{Current Year Value} – \text{Previous Year Value}}{\text{Previous Year Value}} \right) \times 100
$$
This metric helps businesses measure the impact of sustainability initiatives and assess whether energy-saving policies are producing tangible results.
Utility Efficiency Index (UEI)
The Utility Efficiency Index (UEI) is a key performance indicator designed to measure the efficiency of utility consumption over time. It provides a comparative analysis of electricity, water, and heating usage, helping to track improvements or inefficiencies. By normalizing the total consumption relative to a reference value, the UEI enables organizations and households to assess their resource efficiency and identify potential savings. The UEI is calculated as follows:
$$
UEI = \left( \frac{E_{\text{current}} + W_{\text{current}} + H_{\text{current}}}{V_{\text{ref}}} \right) \times 100
$$
Vref is the reference value, which can be a predefined baseline, historical average, or maximum recorded usage.
Interpretation of UEI:
- UEI < 100% → Improved efficiency and reduced consumption compared to the reference value.
- UEI = 100% → Stable consumption at the reference level.
- UEI > 100% → Increased consumption, indicating a decrease in efficiency.
By tracking UEI over time, businesses and households can implement data-driven decisions to optimize energy use and reduce operational costs.
Interpreting the Data and Taking Action
With clear percentage-based comparisons, businesses can make data-driven decisions about energy efficiency. If a particular utility shows an unexpected increase, it may indicate:
- Equipment inefficiencies or failures.
- Unnecessary energy waste (e.g., lights or HVAC systems left running).
- Seasonal demand shifts requiring adjusted energy strategies.
By tracking and analyzing this data, organizations can adjust their practices accordingly and implement targeted cost-saving measures.
Practical Steps to Reduce Utility Costs
Tracking consumption is just the first step—reducing utility costs requires active energy management. Consider implementing these best practices:
- Optimize Heating and Cooling Systems
- Improve Lighting Efficiency
- Reduce Water Consumption
- Implement Smart Electricity Management
- Monitor and Educate
For a more in-depth guide on how to cut your utility bills, check out our article Reducing Energy Consumption: How to Cut Your Bills.
Conclusion
The Utility Cost Savings template provides a structured approach to monitoring energy consumption, identifying cost-saving opportunities, and ensuring long-term efficiency improvements. By leveraging data-driven insights, businesses can take proactive steps toward reducing their environmental impact while lowering expenses. Start tracking your energy usage today and take control of your utility costs with Data Responder!