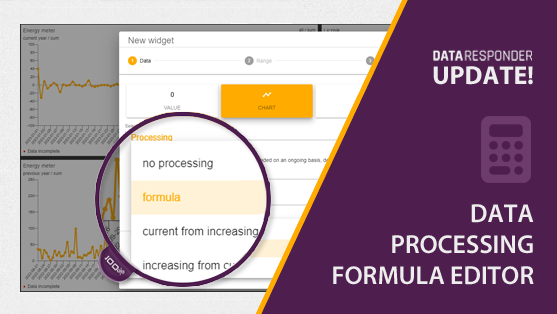
How to use the Formula Editor?
Learn how to effectively use the Formula Editor in Data Responder to create and calculate custom KPIs.
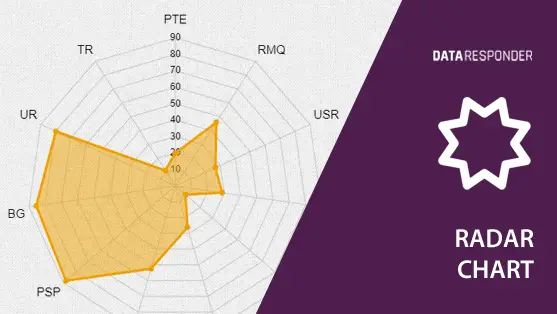
How to create a Radar Chart?
Discover how to create and use radar charts to display multivariate data in a way that highlights
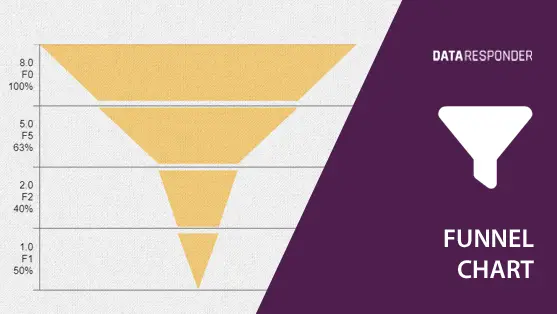
How to create a Funnel Chart?
Learn how to create a funnel chart to visualize conversion rates and sales processes, making your data
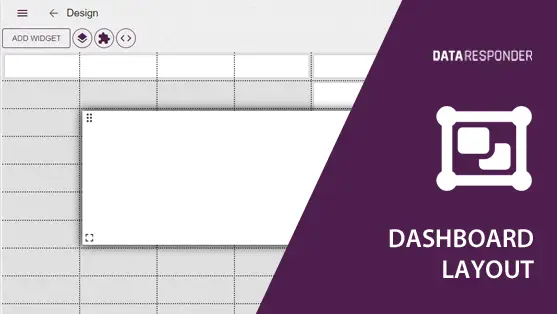
How to design a Dashboard Layout?
Tips and best practices on designing an effective dashboard layout that enhances data visibility and decision-making.
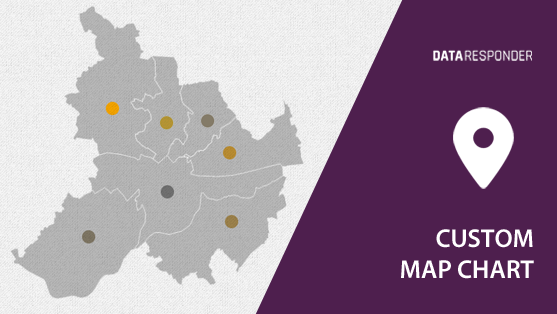
How to create a Custom Map Chart?
Step-by-step guide on how to create a custom map chart to visually represent geographical data and enhance
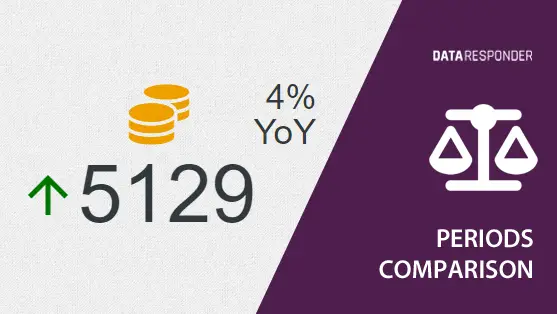
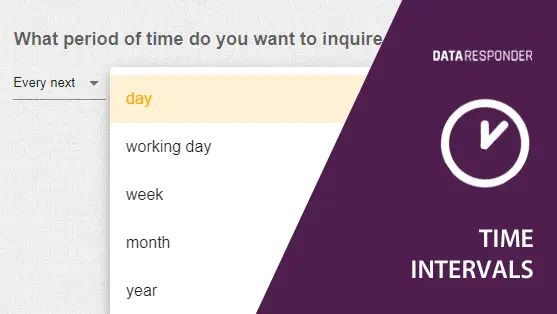
How to Compare Periods?
Find out the best practices for comparing different time periods in data analysis to make accurate and
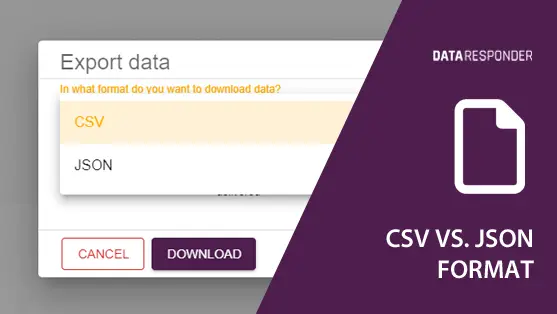
CSV vs. JSON Data Format: which to choose?
Discover the key differences between CSV and JSON data formats to decide which one best suits your
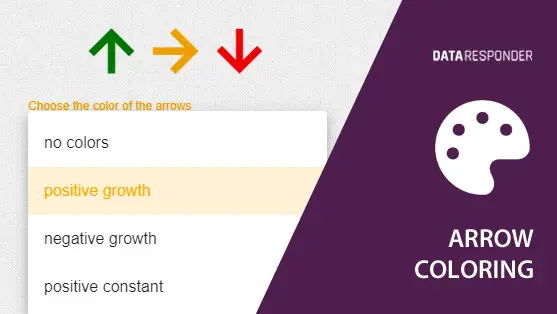
How to Color Arrows in comparisons and why it matters?
Learn how to effectively color arrows in data comparisons to highlight trends and changes, and understand why
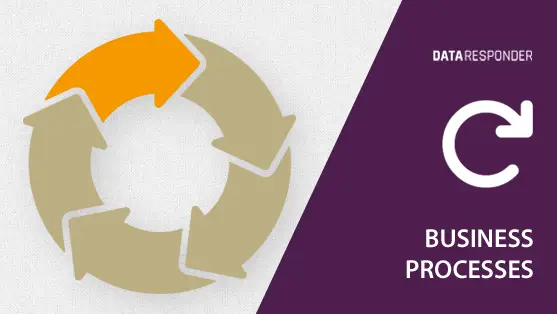
What are Business Processes?
Understand what business processes are, their importance, and how they contribute to organizational efficiency and success.
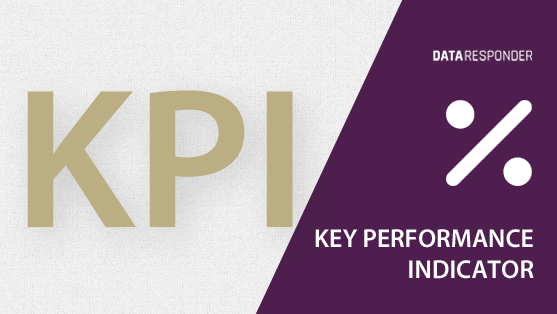
What is a KPI (Key Performance Indicator)?
Learn what KPIs are, how to select the right ones, and why they are crucial for measuring
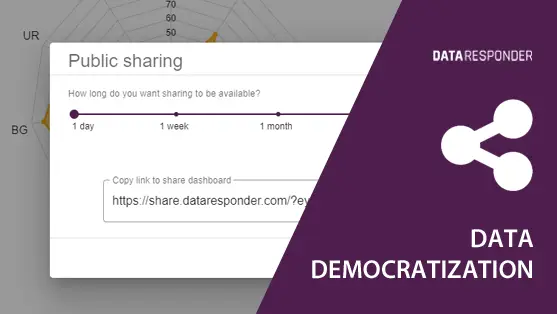
What is data democratization and how to share data?
Discover the concept of data democratization, its benefits, and how to effectively share data across your organization.
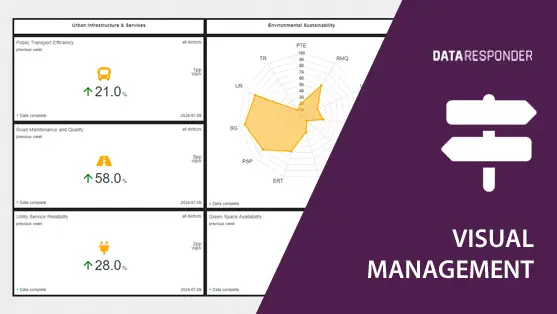
What is Visual Management and how to share dashboards?
Learn about visual management, its benefits, and how to create and share dashboards to enhance organizational transparency
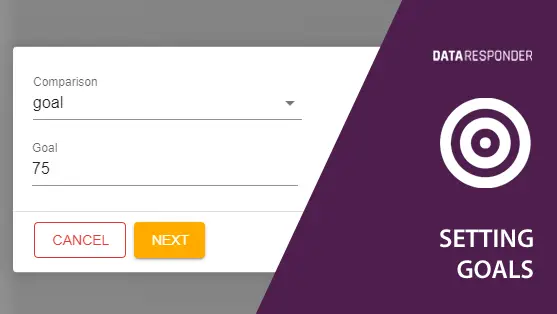
How to set achievable Business Goals?
Discover the art of setting achievable business goals. Align them with your vision and employ the right
How to determine Data Collection Frequency for financial KPIs?
Optimal data collection frequency for accurate financial KPI analysis. Best practices for collecting and analyzing KPI data.

Utility Cost Savings
Keep track of your company’s energy consumption and optimize expenses with the ‘Utility Cost Savings’ template!

Financial Overview
Gain a clear snapshot of your organization’s financial health with the ‘Financial Overview’ template!

Financial Details
Explore detailed financial information with the ‘Financial Details’ template for clear insights!

Monthly Business Review
Maintain regular insight into your operations with reminders. Note key decisions and conclusions from recurring Monthly Business

Internship journal
Enhance the internship experience for your interns with the ‘Internship Journal’ template!

Fruit every tuesday
Boost your team’s energy with fresh fruits with the ‘Fruit Every Tuesday’ inquiring template!

Pizza every friday
Give your team a delicious ending of each week with the ‘Pizza Every Friday’ inquiring template!
