Introduction
Determining the optimal frequency for collecting financial KPI data is crucial for maintaining accurate and actionable insights. The flexibility of systems like Data Responder can significantly enhance this process, tailoring data collection and reporting to meet specific organizational needs.
Understanding Data Collection Frequencies
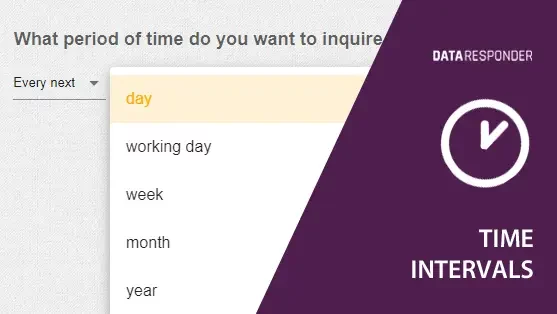
Data Responder allows data querying at various frequencies:
- Daily for granular trends
- Working Days to exclude weekends
- Weekly, Monthly, and Yearly for broader overviews
Each frequency supports different strategic and operational needs, from detailed daily oversight to long-term trend analysis.
Customizing Data Collection in Data Responder
Data Responder’s flexibility extends to grouping collected data into periods like days, weeks, months, quarters, halves, or years, accommodating:
- Organizational Summaries: Aligning with internal reporting periods.
- Regulatory Requirements: Meeting statutory reporting deadlines.
- Strategic vs. Operational Management: Catering to both high-level strategic reviews and detailed operational management.
- Strategic Adjustments: Align data frequency with the need for timely strategic responses to market changes.
- Forecasting Accuracy: Opt for more frequent data collections to enhance the accuracy of forecasts and trend analyses.
- Operational Responsiveness: Ensure data frequency supports quick identification and resolution of operational issues to maintain efficiency.
Selecting the appropriate frequency for data collection is crucial because the granularity of data affects its utility in decision-making. While weekly data can be aggregated to give monthly insights, monthly data cannot be accurately broken down to derive weekly trends. This makes the choice of frequency a strategic decision, ensuring that data collection aligns with the level of detail required for effective management and response to business dynamics.
Examples of Frequency-Specific Data Collection for Financial KPIs
Here are some tailored examples of how frequency choices can directly influence the utility and relevance of financial data:
- Daily: Cash flow, a critical KPI for measuring a company’s ability to manage expenses and maintain liquidity, requires daily monitoring. This frequency ensures managers can quickly identify and address any cash flow issues, maintaining operational stability.
- Weekly: Revenue growth, which tracks changes in revenue over time, benefits from weekly data collection. This allows businesses to spot trends and adjust strategies promptly to optimize financial performance.
- Monthly: Gross profit margin and net profit margin are key metrics for assessing the profitability of a company’s products or services and overall financial health, respectively. Monthly reviews provide a balanced overview, allowing for effective adjustments in cost management and pricing strategies.
- Quarterly: Return on Investment (ROI) is crucial for evaluating the effectiveness of specific investments or projects. Collecting this data quarterly aids in assessing long-term financial returns and aligning investment strategies with business goals.
Best Practices for Setting Collection Frequencies
When determining the frequency of data collection, consider:
- Balance: Weigh management’s need for detailed data against the practicality of data collection without overburdening staff.
- Regularity: Data Responder ensures adherence to set frequencies, simplifying compliance with internal and external reporting cycles.
- Scalability: Adjust frequencies as business needs evolve, utilizing Data Responder’s capacity to scale data collection up or down seamlessly.
- Synchronization: When setting data collection frequencies, consider synchronizing data collection across various departments and locations. This ensures consistency and comparability of data, which is crucial for aggregating insights and making informed decisions on a company-wide scale.
Conclusion
Setting the right data collection frequency is essential for effective financial KPI analysis. With tools like Data Responder, businesses can customize these settings to reflect their unique operational rhythms and strategic imperatives, ensuring they always have the most relevant and accurate data at hand.

