Introduction
Visual management is an approach that uses visual tools and techniques to present information, organize work, and monitor progress in a business environment. It is especially powerful in settings where information transparency and quick access to data are critical for decision-making, motivation and efficiency.
The benefits of Visual Management
Visual management improves communication, operational efficiency, and team engagement by making information readily accessible and easy to understand. Here are some significant benefits:
- Enhanced Communication: Visual tools make it easier for team members to understand information, helping ensure that everyone is on the same page.
- Quick Problem Identification: Managers can rapidly identify issues, delays, or inefficiencies, allowing for prompt corrective actions.
- Boosted Team Engagement: Clear insights into goals, priorities, and progress help employees understand their contributions to the company’s success and feel more connected to the organizational objectives.
Implementing Visual Management Tools
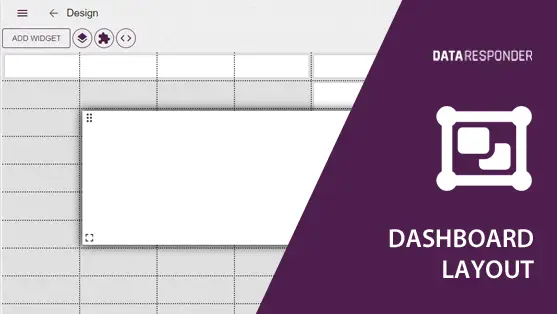
Data Responder offers a suite of visualization tools designed for creating dashboards that serve as monitoring boards to track and display ongoing results clearly and effectively. Here’s how you can utilize these tools:
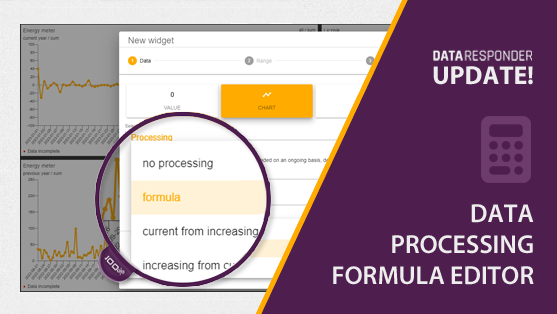
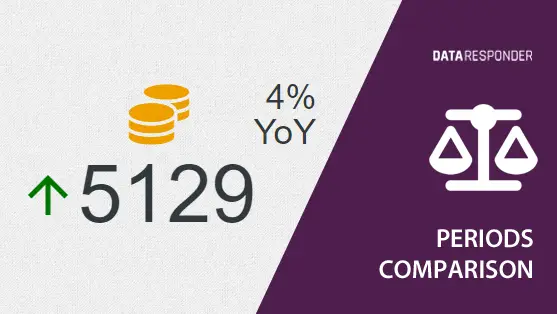
- Numeric Indicators: Use numeric indicators to present key metrics such as sales figures, production rates, or customer satisfaction scores. These indicators can include directional color arrows or percentage changes to denote trends, providing a snapshot of performance at a glance.
- Charts: Leverage a variety of chart formats to convey data comprehensively:
- Bar and Line Charts: Ideal for depicting data trends over time, helping viewers quickly assess progress and patterns.
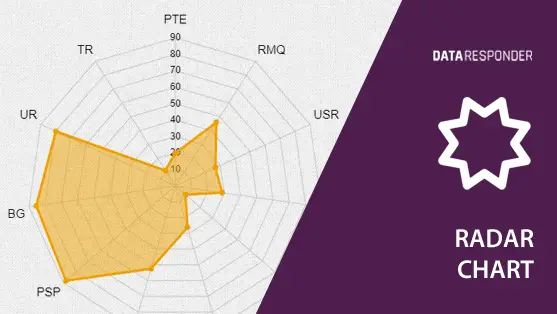
- Radar Charts: Use these to compare multiple variables, such as team performance across different competencies, in a consolidated format.
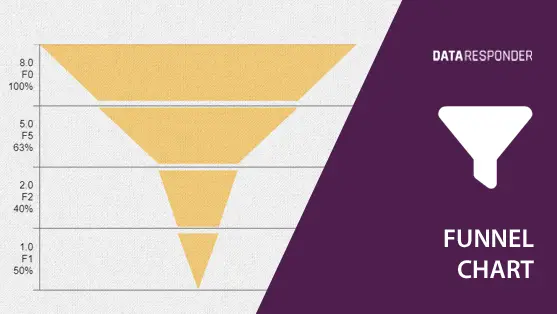
- Funnel Charts: Perfect for displaying sequential stages, such as the steps in a sales process or project milestones, illustrating the flow and reduction at each stage.
- Tables: Tables are used to list detailed data in a clear, organized manner and provide a structured overview of metrics, useful for periodic reviews of specific data points.
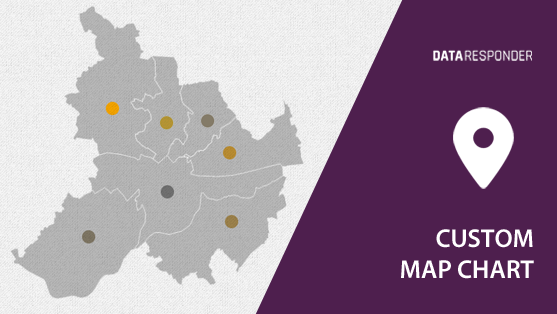
- Maps: Implement geographical maps or diagrams to show data distribution across different regions, such as sales territories, market penetration, or regional performance metrics. These maps offer a spatial perspective of data that can help in strategic planning and performance evaluation.
By employing these visualization tools in your dashboards within Data Responder, you can create effective visual management systems that enhance the clarity and accessibility of key business metrics, enabling consistent monitoring and assessment.
Sharing Dashboards with Data Responder
In Data Responder, you can make your dashboards public to ensure all team members can access the visual data they need without the complications of permissions. Here’s how you can share dashboards effectively:
- Create a Public Dashboard: Build your dashboard in Data Responder, ensuring it includes all the necessary data for team-wide transparency.
- Develop Variants: If different teams require access to specific data, create multiple dashboards with varying levels of detail or data relevant to each group.
- Share the Dashboard: Distribute links to the dashboards via email or integrate them into your company’s internal systems for easy access.
- Update Regularly: Update the content and layouts of your dashboards to only show what’s important right now and ensure all team members have the most up-to-date information.
Conclusion
Visual management is not just a trend; it is a proven method to enhance communication, efficiency, and engagement within an organization. By using tools like Data Responder to create and share effective dashboards, your company can realize significant benefits, fostering a culture of transparency and continual improvement.