Introduction
Comparing different time periods in data analysis is essential for understanding trends, making strategic decisions, and forecasting future performance. This article explores the best practices for making these comparisons effectively and meaningfully.
Understanding Period Comparisons
Period comparisons involve analyzing data from different time frames to identify patterns, trends, and changes. Common types include:
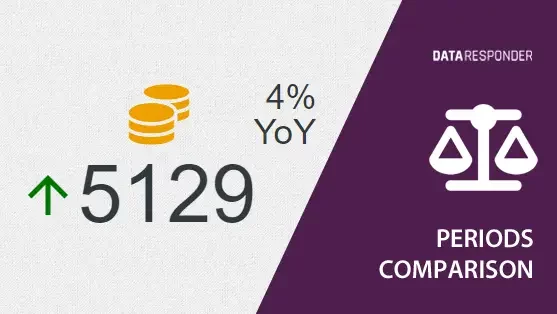
- Year-over-Year (YoY): Comparing data from one year to the corresponding year previously, useful for planning and evaluating long-term strategy
- Half-Year-over-Half-Year (HoH): Analysis of data from one half of the year with the same half in previous years
- Quarter-over-Quarter (QoQ): Examining changes from one quarter to the previous one to quickly capture shifts in business dynamics
- Month-to-Month (MoM): Often used to track short-term trends or respond to compliance with strategic plan implementation
- Week-over-Week (WoW): Useful for operational changes that need quick assessment
- Day-over-Day (DoD): Ideal for granular, immediate data analysis, often used in high-frequency trading environments
Best Practices for Period Comparison
When managers review periodic data comparisons, they should utilize the insights for both strategic planning and operational adjustments:
- Timing and Frequency of Reviews: Managers should schedule regular reviews of these comparisons during strategic meetings or operational reviews to ensure timely decisions and adjustments. Weekly, monthly, or quarterly reviews could align with the data comparison periods like MoM or QoQ.
- Decision Making: Insights from period comparisons should directly inform business decisions, such as adjusting marketing strategies based on consumer behavior trends or reallocating resources to improve production efficiency.
- Presentations and Reports: Data comparisons should be included in reports and presentations to stakeholders to provide a clear picture of business trends, operational success, and areas needing attention.
- Consideration of External Factors: Managers need to account for external influences such as economic conditions, competitive actions, and market trends. These factors can significantly impact the interpretation of internal data.
- Sources for External Information: Managers should utilize industry reports, economic forecasts, competitive analysis, and market research to complement their internal data, providing a well-rounded view of the business landscape.
Using these best practices, managers can effectively leverage period comparisons to drive business success, ensuring that their decisions are data-informed and contextually relevant.
Data Responder Capabilities
Data Responder enhances these comparisons with settings for analyzing analogous periods in:
- Previous: Compare the current period with the immediate past period (e.g., February 2024 to January 2024)
- Last Year: Compare the current period with the corresponding period in the previous year (e.g., February 2024 to February 2023)
Conclusion
Effective period comparison is a cornerstone of data-driven decision-making. With tools like Data Responder, businesses can automate and streamline these comparisons, enabling quick and accurate insights into their data trends.

