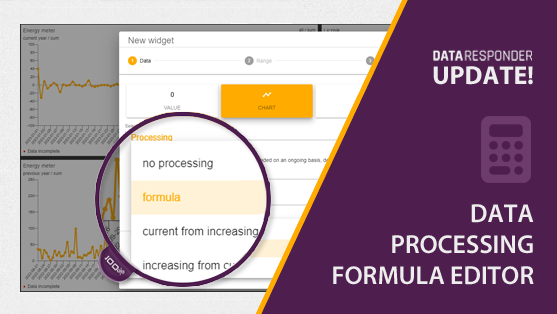
How to use the Formula Editor?
Learn how to effectively use the Formula Editor in Data Responder to create and calculate

Learn how to effectively use the Formula Editor in Data Responder to create and calculate
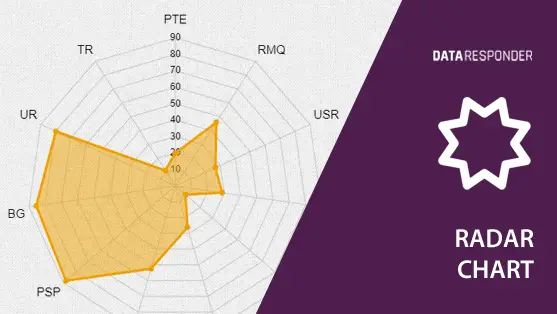
Discover how to create and use radar charts to display multivariate data in a way
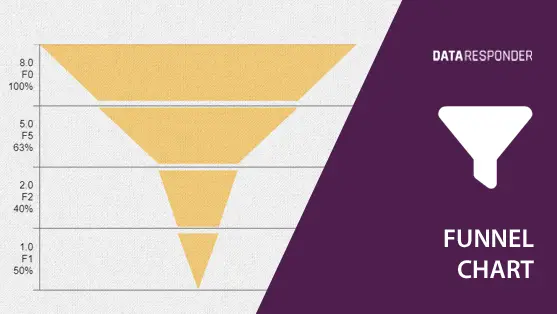
Learn how to create a funnel chart to visualize conversion rates and sales processes, making
Tips and best practices on designing an effective dashboard layout that enhances data visibility and
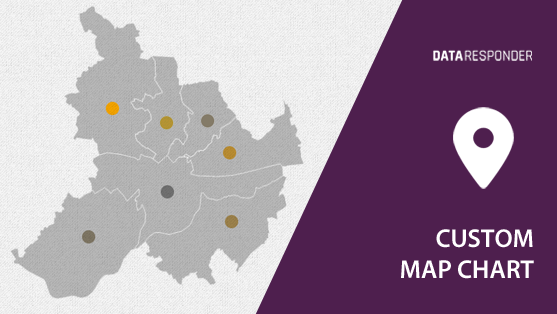
Step-by-step guide on how to create a custom map chart to visually represent geographical data
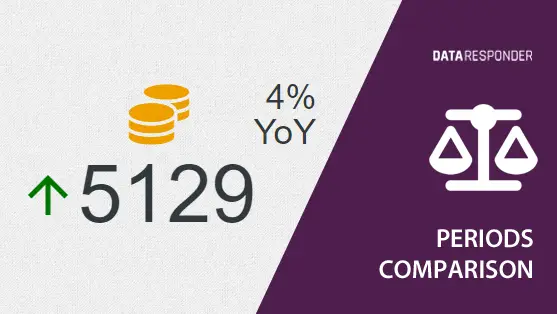
Find out the best practices for comparing different time periods in data analysis to make
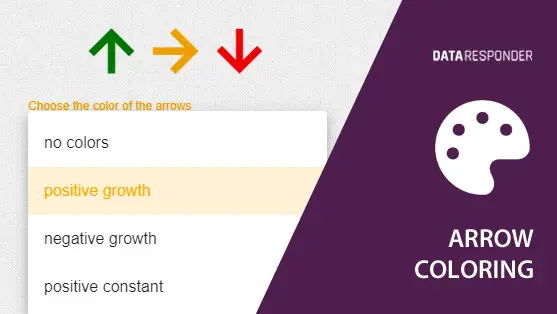
Learn how to effectively color arrows in data comparisons to highlight trends and changes, and
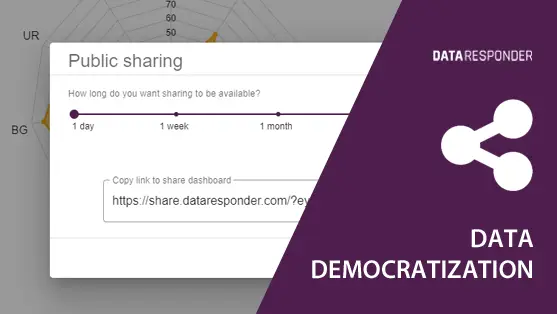
Discover the concept of data democratization, its benefits, and how to effectively share data across
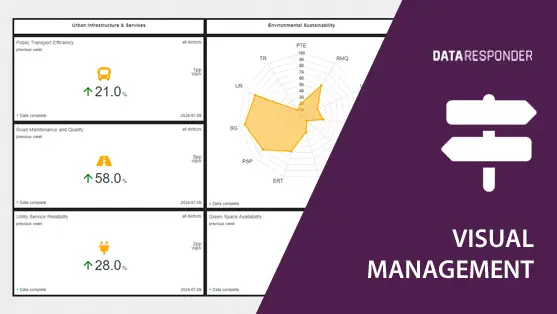
Learn about visual management, its benefits, and how to create and share dashboards to enhance
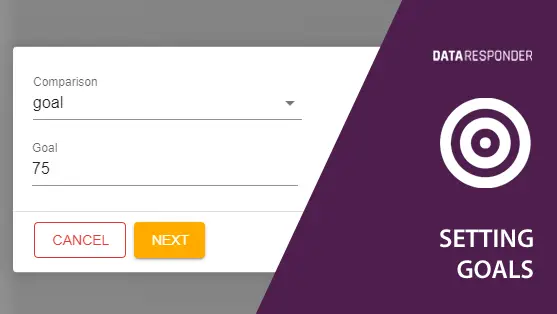
Discover the art of setting achievable business goals. Align them with your vision and employ

Data Responder
Al. Zwyciestwa 96/98
81-451 Gdynia, Poland
+48 508 513 740
info@dataresponder.com